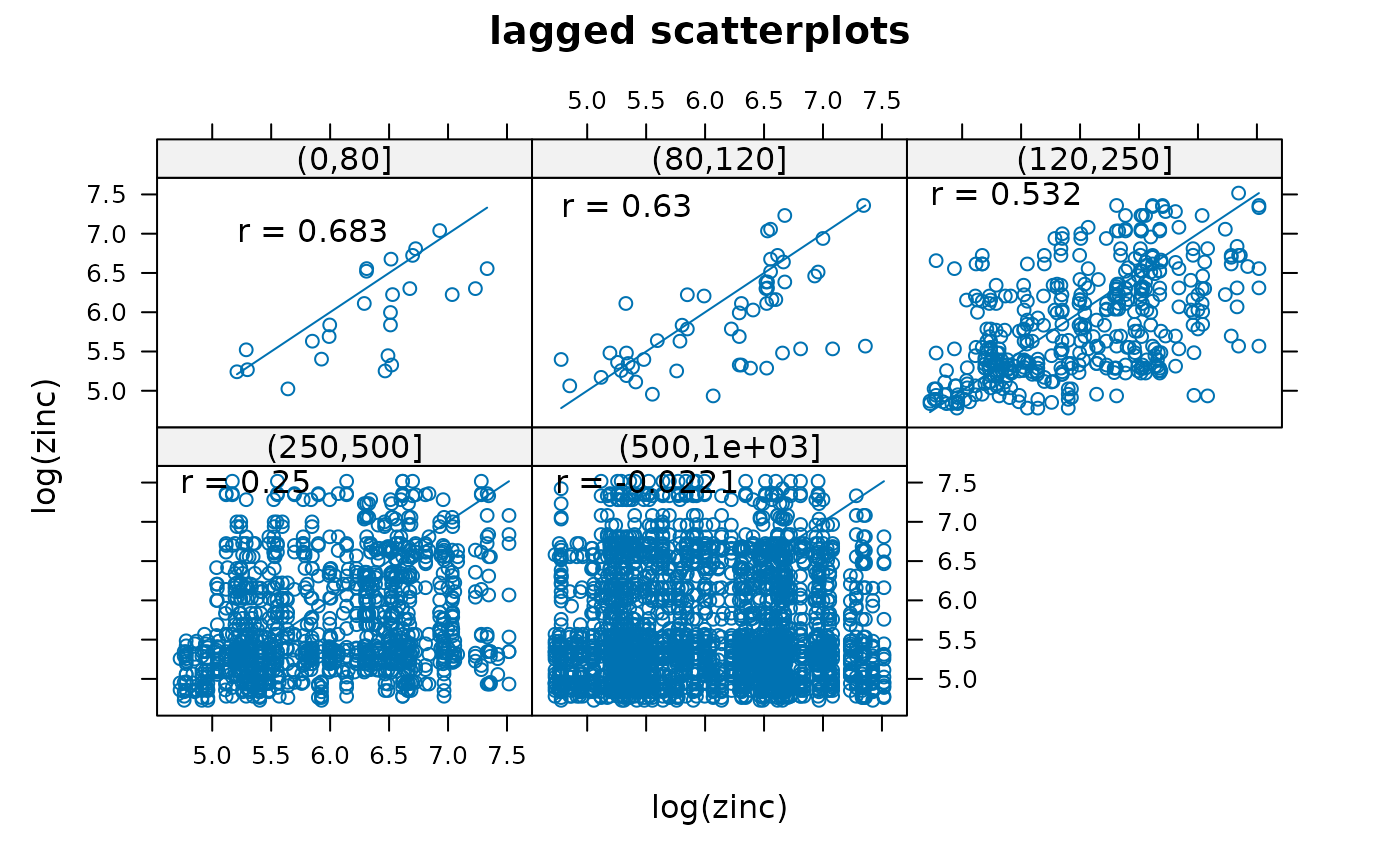
Produce h-scatterplot
hscat.RdProduces h-scatterplots, where point pairs having specific separation distances are plotted. This function is a wrapper around xyplot.
Usage
hscat(formula, data, breaks, pch = 3, cex = .6, mirror = FALSE,
  variogram.alpha = 0, as.table = TRUE,...)
Arguments
- formula
specifies the dependent variable
- data
data where the variable in formula is resolved
- breaks
distance class boundaries
- pch
plotting symbol
- cex
plotting symbol size
- mirror
logical; duplicate all points mirrored along x=y? (note that correlations are those of the points plotted)
- variogram.alpha
parameter to be passed as alpha parameter to variogram; if alpha is specified it will only affect xyplot by being passed through ...
- as.table
logical; if
TRUE, panels plot top-to-bottom- ...
parameters, passed to variogram and xyplot