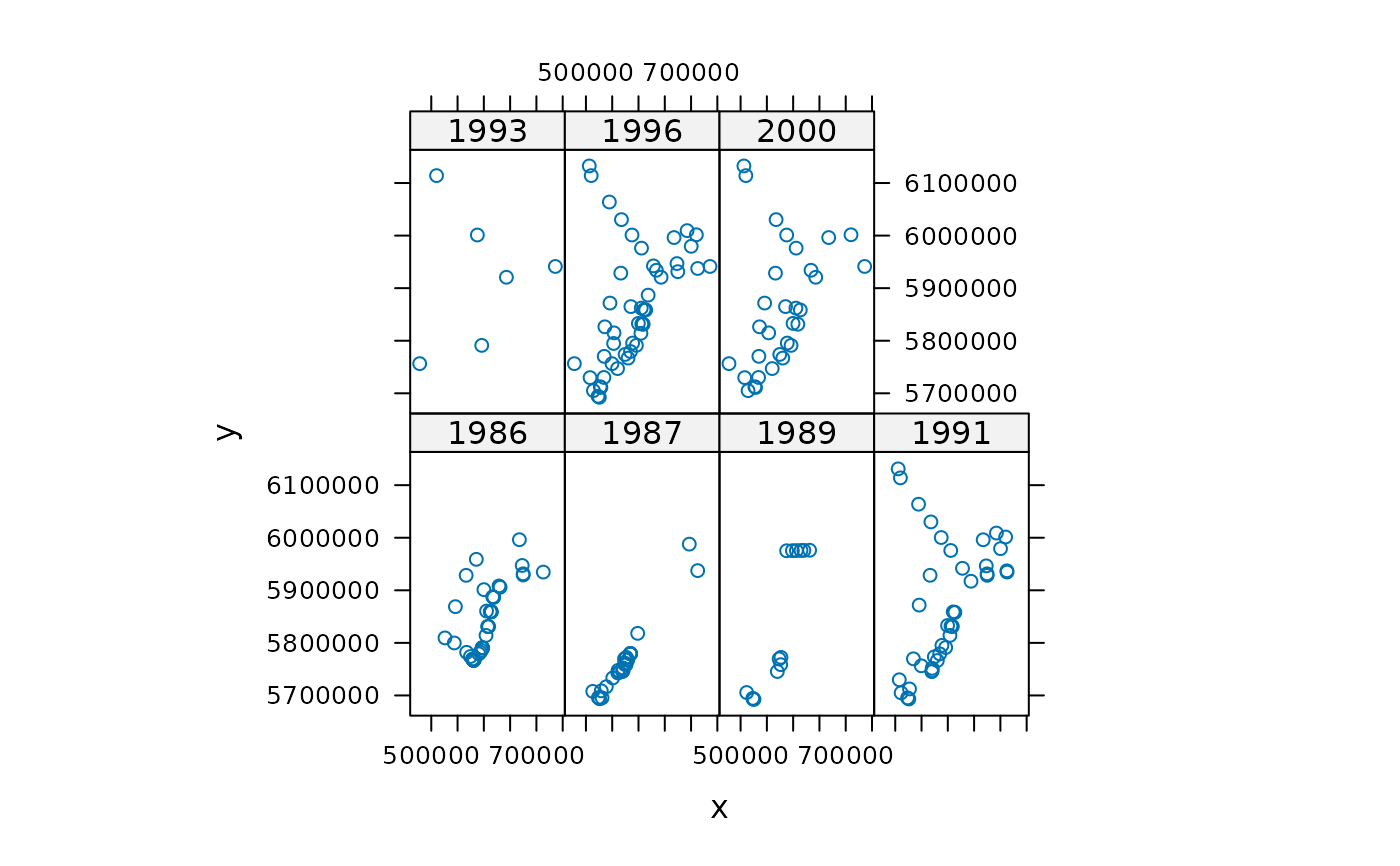
PCB138 measurements in sediment at the NCP, the Dutch part of the North Sea
pcb.RdPCB138 measurements in sediment at the NCP, which is the Dutch part of the North Sea
Usage
data(pcb)Format
This data frame contains the following columns:
- year
measurement year
- x
x-coordinate; UTM zone 31
- y
y-coordinate; UTM zone 31
- coast
distance to coast of the Netherlands, in km.
- depth
sea water depth, m.
- PCB138
PCB-138, measured on the sediment fraction smaller than 63 \(\mu\), in \(\mu g/kg\) dry matter; BUT SEE NOTE BELOW
- yf
year; as factor
Note
A note of caution: The PCB-138 data are provided only to be able to re-run the analysis done in Pebesma and Duin (2004; see references below). If you want to use these data for comparison with PCB measurements elsewhere, or if you want to compare them to regulation standards, or want to use these data for any other purpose, you should first contact mailto:basisinfodesk@rikz.rws.minvenw.nl. The reason for this is that several normalisations were carried out that are not reported here, nor in the paper below.
References
Pebesma, E. J., and Duin, R. N. M. (2005). Spatial patterns of temporal change in North Sea sediment quality on different spatial scales. In P. Renard, H. Demougeot-Renard and R. Froidevaux (Eds.), Geostatistics for Environmental Applications: Proceedings of the Fifth European Conference on Geostatistics for Environmental Applications (pp. 367-378): Springer.