This vignette shows how some of the tidyverse verbs can be used on
stars objects.
The stars and tidyverse packages are loaded
by
library(stars)
## Loading required package: abind
## Loading required package: sf
## Linking to GEOS 3.12.1, GDAL 3.8.4, PROJ 9.4.0; sf_use_s2() is TRUE
library(dplyr)
##
## Attaching package: 'dplyr'
## The following objects are masked from 'package:stats':
##
##     filter, lag
## The following objects are masked from 'package:base':
##
##     intersect, setdiff, setequal, union
Methods now available for class stars are
methods(class = "stars")
## [1] [ [[<- [<- %in%
## [5] $<- adrop aggregate aperm
## [9] as_tibble as.data.frame as.Date as.POSIXct
## [13] c coerce contour cut
## [17] dim dimnames dimnames<- droplevels
## [21] expand_dimensions filter hist image
## [25] initialize is.na Math merge
## [29] mutate Ops plot prcomp
## [33] predict print pull rename
## [37] select show slice slotsFromS3
## [41] split st_apply st_area st_as_sf
## [45] st_as_sfc st_as_stars st_bbox st_coordinates
## [49] st_crop st_crs st_crs<- st_dimensions
## [53] st_dimensions<- st_downsample st_extract st_geometry
## [57] st_geotransform st_geotransform<- st_interpolate_aw st_intersects
## [61] st_join st_mosaic st_normalize st_redimension
## [65] st_rotate st_sample st_set_bbox st_transform
## [69] st_write time transmute write_stars
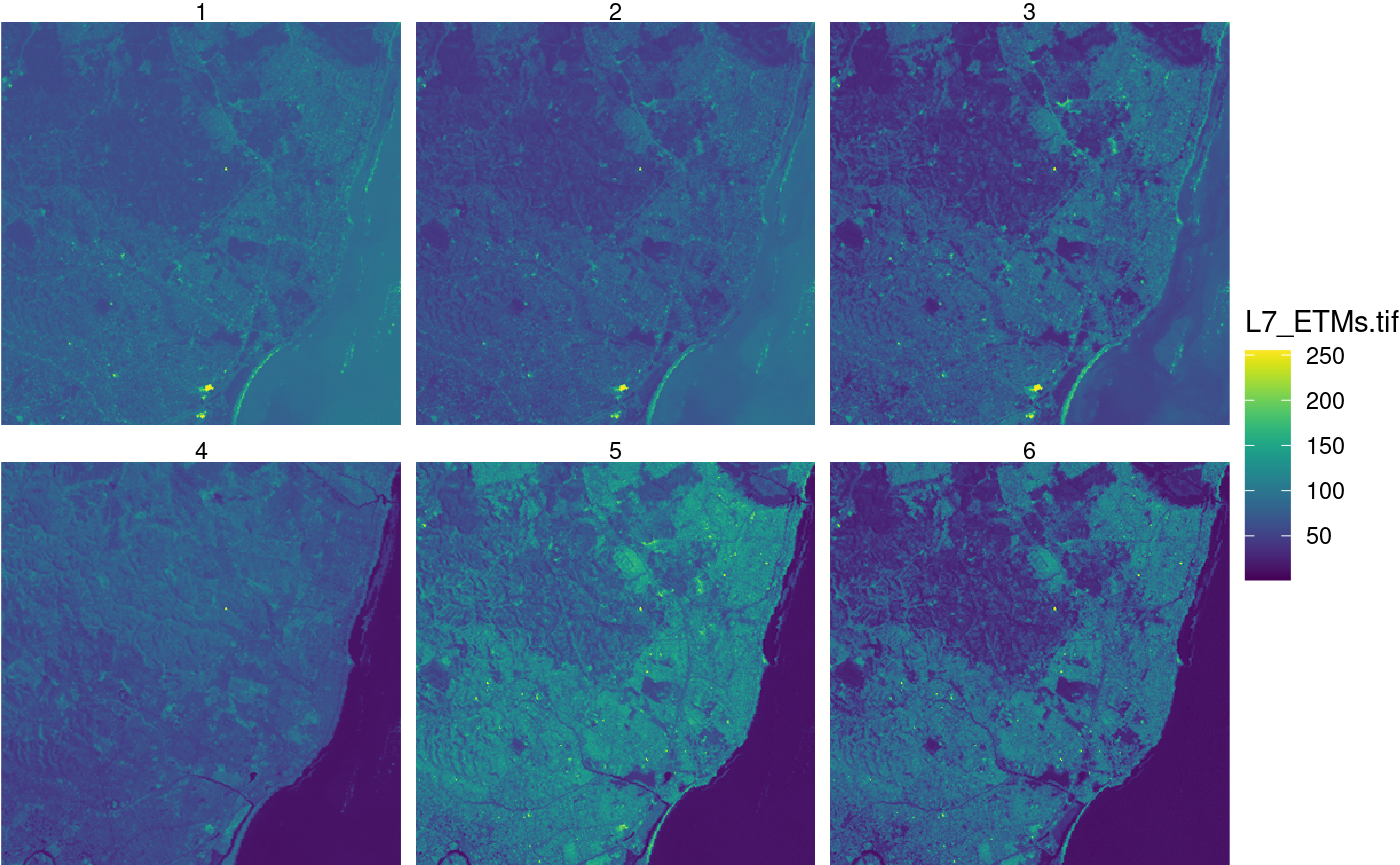
## see '?methods' for accessing help and source codeWe will work with a three-band section of a landsat image:
system.file("tif/L7_ETMs.tif", package = "stars") |>
    read_stars() -> x
x
## stars object with 3 dimensions and 1 attribute
## attribute(s):
##              Min. 1st Qu. Median     Mean 3rd Qu. Max.
## L7_ETMs.tif     1      54     69 68.91242      86  255
## dimension(s):
##      from  to  offset delta                     refsys point x/y
## x       1 349  288776  28.5 SIRGAS 2000 / UTM zone 25S FALSE [x]
## y       1 352 9120761 -28.5 SIRGAS 2000 / UTM zone 25S FALSE [y]
## band    1   6      NA    NA                         NA    NA
slice
slice slices a sub-array out of the cube; this is done
by specifying the dimension on which to act, and the slice number.
x |> slice(band, 6) -> x6
x6
## stars object with 2 dimensions and 1 attribute
## attribute(s):
##              Min. 1st Qu. Median     Mean 3rd Qu. Max.
## L7_ETMs.tif     1      32     60 59.97521      88  255
## dimension(s):
##   from  to  offset delta                     refsys point x/y
## x    1 349  288776  28.5 SIRGAS 2000 / UTM zone 25S FALSE [x]
## y    1 352 9120761 -28.5 SIRGAS 2000 / UTM zone 25S FALSE [y]
It returns a lower-dimensional array if a single element is selected along the slice dimension.
filter
Similar to slice, filter selects on
dimensions but evaluates their values rather than their index: in
x |> filter(x > 289000, x < 291000, band > 3) -> x7
x7
## stars object with 3 dimensions and 1 attribute
## attribute(s):
##              Min. 1st Qu. Median     Mean 3rd Qu. Max.
## L7_ETMs.tif     5      54     70 71.79194      88  252
## dimension(s):
##      from  to  offset delta                     refsys point x/y
## x       1  70  289004  28.5 SIRGAS 2000 / UTM zone 25S FALSE [x]
## y       1 352 9120761 -28.5 SIRGAS 2000 / UTM zone 25S FALSE [y]
## band    1   3       4     1                         NA    NA
the subarray is created based on the x coordinate values.
Note that filter converts the object to a
tbl_cube, and uses the dplyr
filter method for tbl_cube objects. This has
the limitation that stars objects with rectilinear,
curvilinear or simple feature geometries cannot be handled. For such
objects, using regular [ selection or using
st_crop may be an alternative.
mutate
x |> mutate(band2 = 2 * L7_ETMs.tif) -> x2
x2
## stars object with 3 dimensions and 2 attributes
## attribute(s):
##              Min. 1st Qu. Median      Mean 3rd Qu. Max.
## L7_ETMs.tif     1      54     69  68.91242      86  255
## band2           2     108    138 137.82484     172  510
## dimension(s):
##      from  to  offset delta                     refsys point x/y
## x       1 349  288776  28.5 SIRGAS 2000 / UTM zone 25S FALSE [x]
## y       1 352 9120761 -28.5 SIRGAS 2000 / UTM zone 25S FALSE [y]
## band    1   6      NA    NA                         NA    NA
select
select selects an attribute, or a set of attributes:
x2 |> select(band2) -> x9
x9
## stars object with 3 dimensions and 1 attribute
## attribute(s):
##        Min. 1st Qu. Median     Mean 3rd Qu. Max.
## band2     2     108    138 137.8248     172  510
## dimension(s):
##      from  to  offset delta                     refsys point x/y
## x       1 349  288776  28.5 SIRGAS 2000 / UTM zone 25S FALSE [x]
## y       1 352 9120761 -28.5 SIRGAS 2000 / UTM zone 25S FALSE [y]
## band    1   6      NA    NA                         NA    NA
geom_stars
geom_raster is a ggplot2 geom function that
accepts stars objects as its data argument
and
- sets up the raster or vector spatial coordinates as plot dimensions, and the first attribute as the fill variable
- allows for downsampling (without choosing a suitable downsampling level)
- chooses between using
geom_raster,geom_rectandgeom_sfdepending on whether the geometry is regular, rectilinear or has vector geometries
An example use is
library(ggplot2)
library(viridis)
## Loading required package: viridisLite
ggplot() +
  geom_stars(data = x) +
  coord_equal() +
  facet_wrap(~band) +
  theme_void() +
  scale_fill_viridis() +
  scale_x_discrete(expand = c(0, 0)) +
  scale_y_discrete(expand = c(0, 0))