cut methods for stars objects
Details
R's factor only works for vectors, not for arrays or matrices. This is a work-around (or hack?) to keep the factor levels generated by cut and use them in plots.
Examples
tif = system.file("tif/L7_ETMs.tif", package = "stars")
x = read_stars(tif)
cut(x, c(0, 50, 100, 255))
#> stars object with 3 dimensions and 1 attribute
#> attribute(s):
#> L7_ETMs.tif
#> (0,50] :156060
#> (50,100] :503764
#> (100,255]: 77264
#> dimension(s):
#> from to offset delta refsys point x/y
#> x 1 349 288776 28.5 SIRGAS 2000 / UTM zone 25S FALSE [x]
#> y 1 352 9120761 -28.5 SIRGAS 2000 / UTM zone 25S FALSE [y]
#> band 1 6 NA NA NA NA
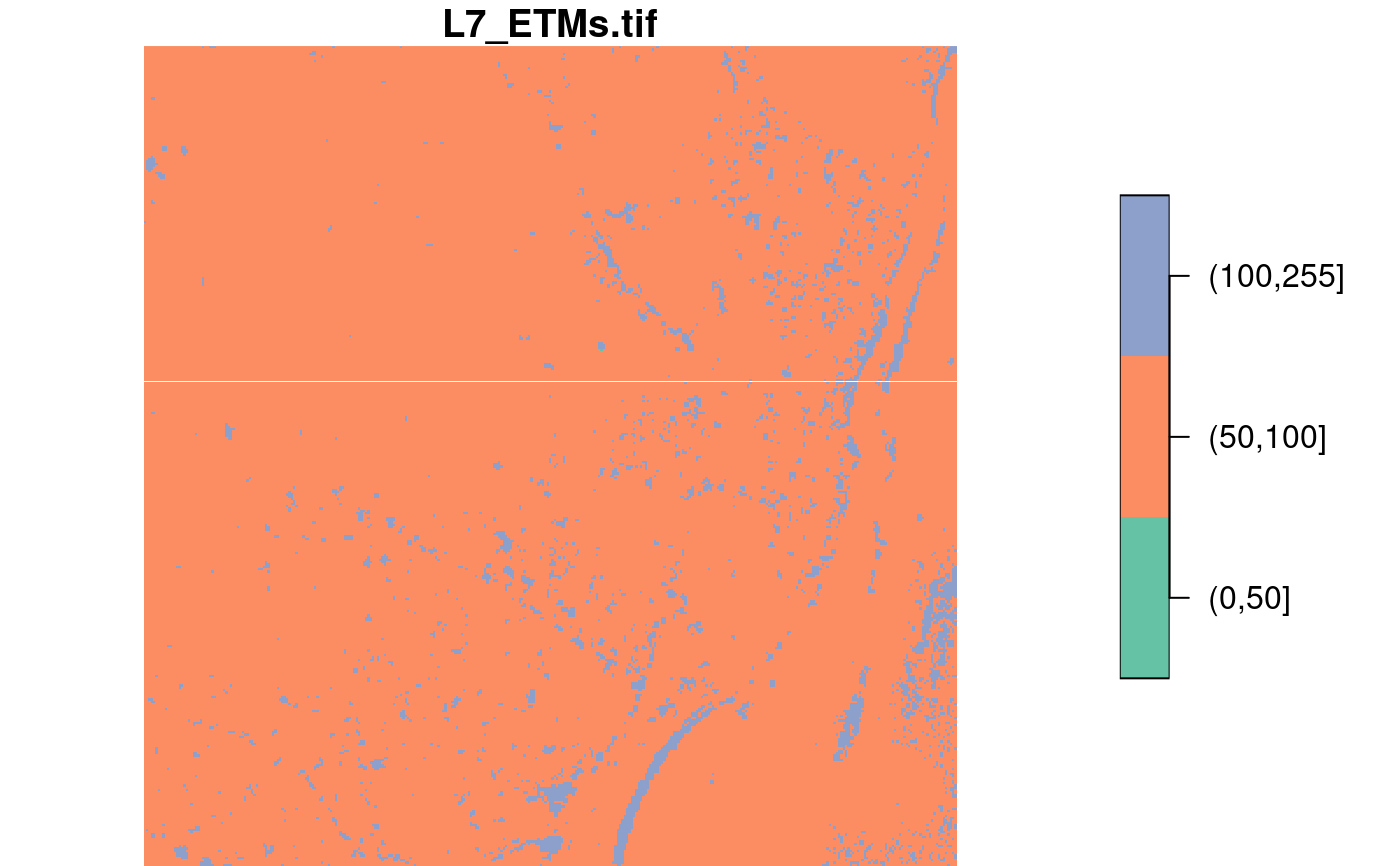
cut(x[,,,1], c(0, 50, 100, 255))
#> stars object with 3 dimensions and 1 attribute
#> attribute(s):
#> L7_ETMs.tif
#> (0,50] : 1
#> (50,100] :117134
#> (100,255]: 5713
#> dimension(s):
#> from to offset delta refsys point x/y
#> x 1 349 288776 28.5 SIRGAS 2000 / UTM zone 25S FALSE [x]
#> y 1 352 9120761 -28.5 SIRGAS 2000 / UTM zone 25S FALSE [y]
#> band 1 1 NA NA NA NA
plot(cut(x[,,,1], c(0, 50, 100, 255)))
 tif = system.file("tif/L7_ETMs.tif", package = "stars")
x1 = read_stars(tif)
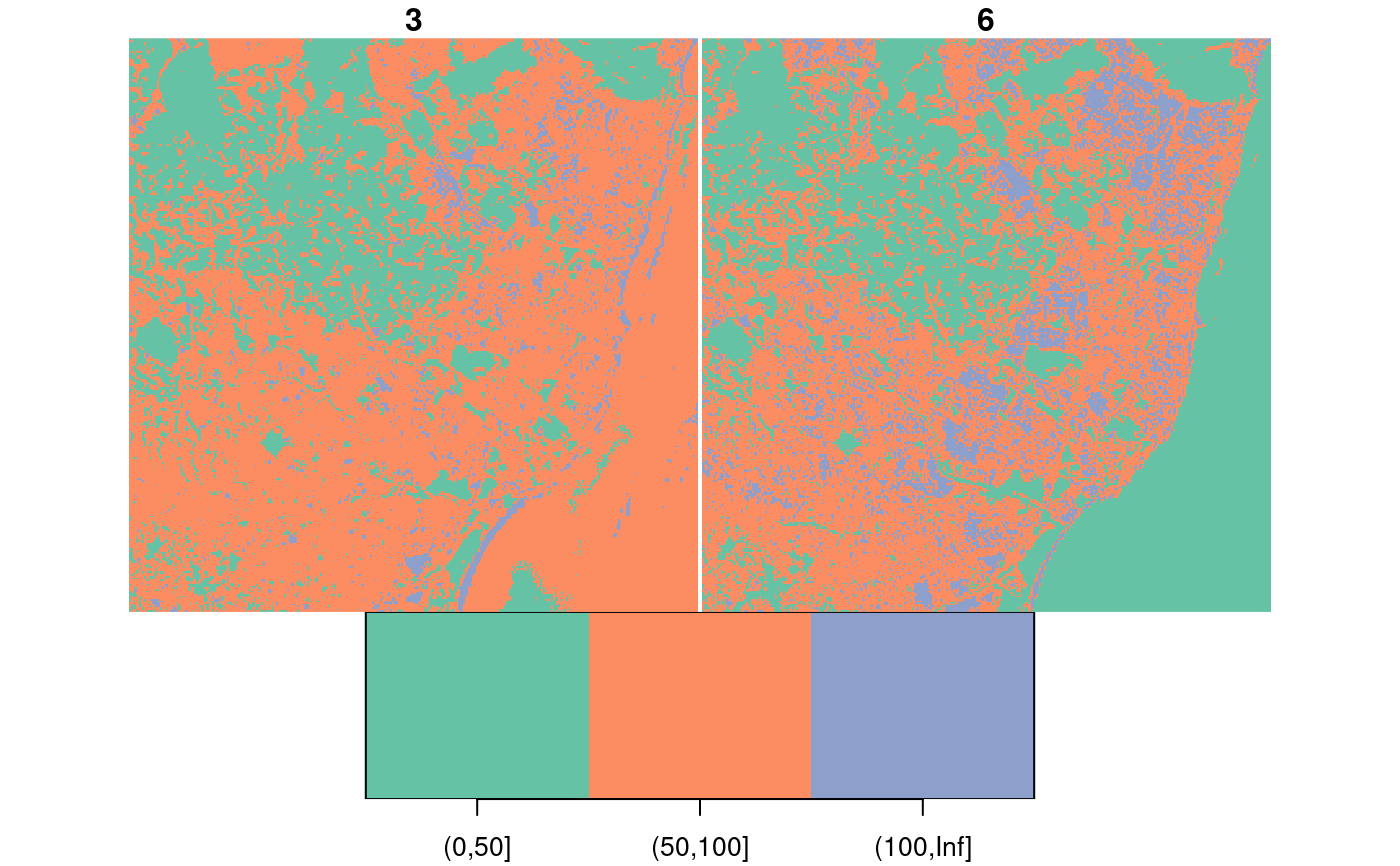
(x1_cut = cut(x1, breaks = c(0, 50, 100, Inf))) # shows factor in summary
#> stars object with 3 dimensions and 1 attribute
#> attribute(s):
#> L7_ETMs.tif
#> (0,50] :156060
#> (50,100] :503764
#> (100,Inf]: 77264
#> dimension(s):
#> from to offset delta refsys point x/y
#> x 1 349 288776 28.5 SIRGAS 2000 / UTM zone 25S FALSE [x]
#> y 1 352 9120761 -28.5 SIRGAS 2000 / UTM zone 25S FALSE [y]
#> band 1 6 NA NA NA NA
plot(x1_cut[,,,c(3,6)]) # propagates through [ and plot
tif = system.file("tif/L7_ETMs.tif", package = "stars")
x1 = read_stars(tif)
(x1_cut = cut(x1, breaks = c(0, 50, 100, Inf))) # shows factor in summary
#> stars object with 3 dimensions and 1 attribute
#> attribute(s):
#> L7_ETMs.tif
#> (0,50] :156060
#> (50,100] :503764
#> (100,Inf]: 77264
#> dimension(s):
#> from to offset delta refsys point x/y
#> x 1 349 288776 28.5 SIRGAS 2000 / UTM zone 25S FALSE [x]
#> y 1 352 9120761 -28.5 SIRGAS 2000 / UTM zone 25S FALSE [y]
#> band 1 6 NA NA NA NA
plot(x1_cut[,,,c(3,6)]) # propagates through [ and plot