create an array with dimension values
Examples
tif = system.file("tif/L7_ETMs.tif", package = "stars")
x1 = read_stars(tif)
(x = st_dim_to_attr(x1))
#> stars object with 3 dimensions and 3 attributes
#> attribute(s):
#>            Min. 1st Qu.    Median      Mean 3rd Qu.      Max.
#> x      288790.5  291270  293749.5  293749.5  296229  298708.5
#> y     9110743.0 9113244 9115744.8 9115744.8 9118246 9120746.5
#> band        1.0       2       3.5       3.5       5       6.0
#> dimension(s):
#>      from  to  offset delta                     refsys point x/y
#> x       1 349  288776  28.5 SIRGAS 2000 / UTM zone 25S FALSE [x]
#> y       1 352 9120761 -28.5 SIRGAS 2000 / UTM zone 25S FALSE [y]
#> band    1   6      NA    NA                         NA    NA
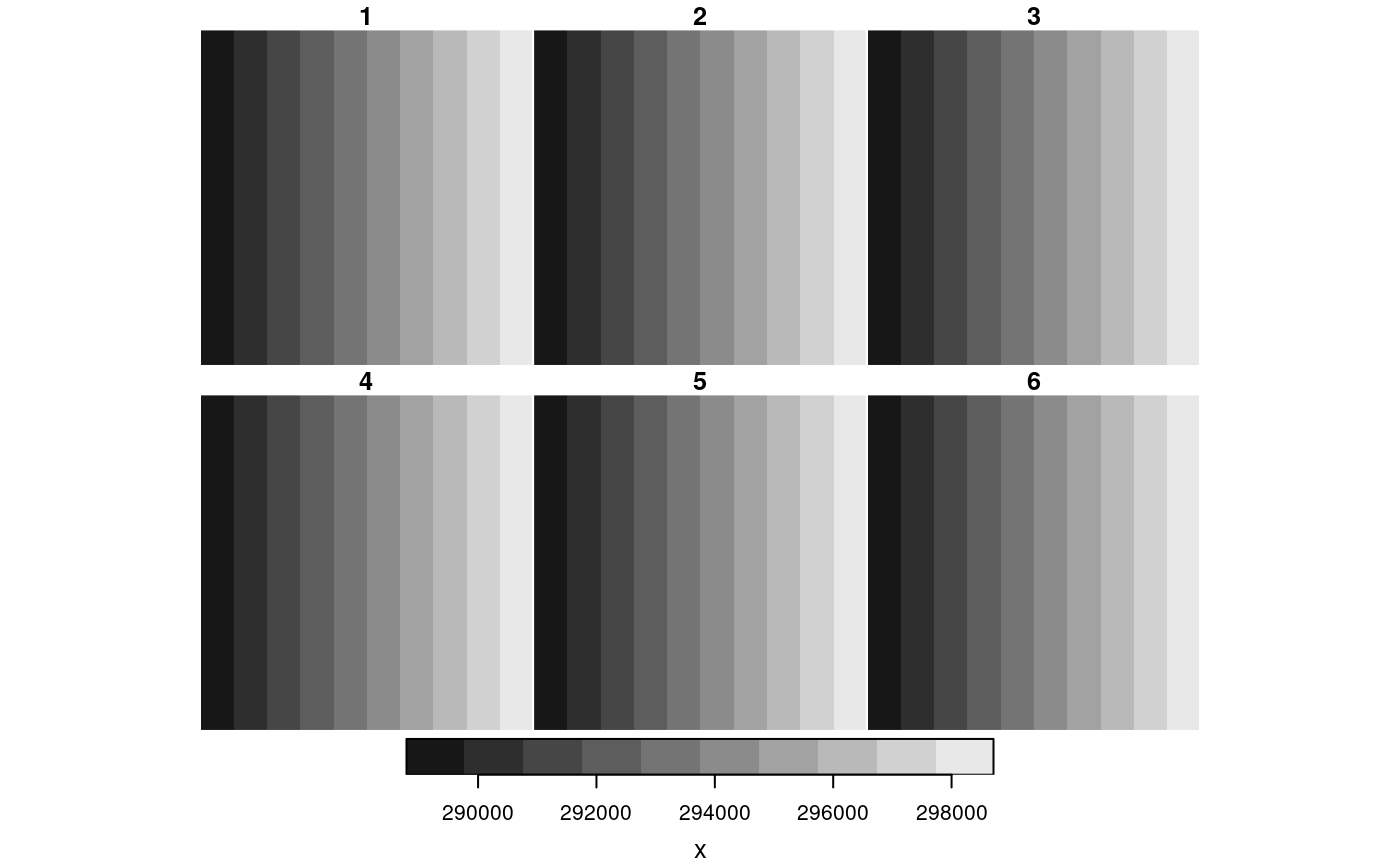
plot(x)

(x = st_dim_to_attr(x1, 2:3))
#> stars object with 3 dimensions and 2 attributes
#> attribute(s):
#>          Min. 1st Qu.    Median      Mean 3rd Qu.    Max.
#> y     9110743 9113244 9115744.8 9115744.8 9118246 9120747
#> band        1       2       3.5       3.5       5       6
#> dimension(s):
#>      from  to  offset delta                     refsys point x/y
#> x       1 349  288776  28.5 SIRGAS 2000 / UTM zone 25S FALSE [x]
#> y       1 352 9120761 -28.5 SIRGAS 2000 / UTM zone 25S FALSE [y]
#> band    1   6      NA    NA                         NA    NA
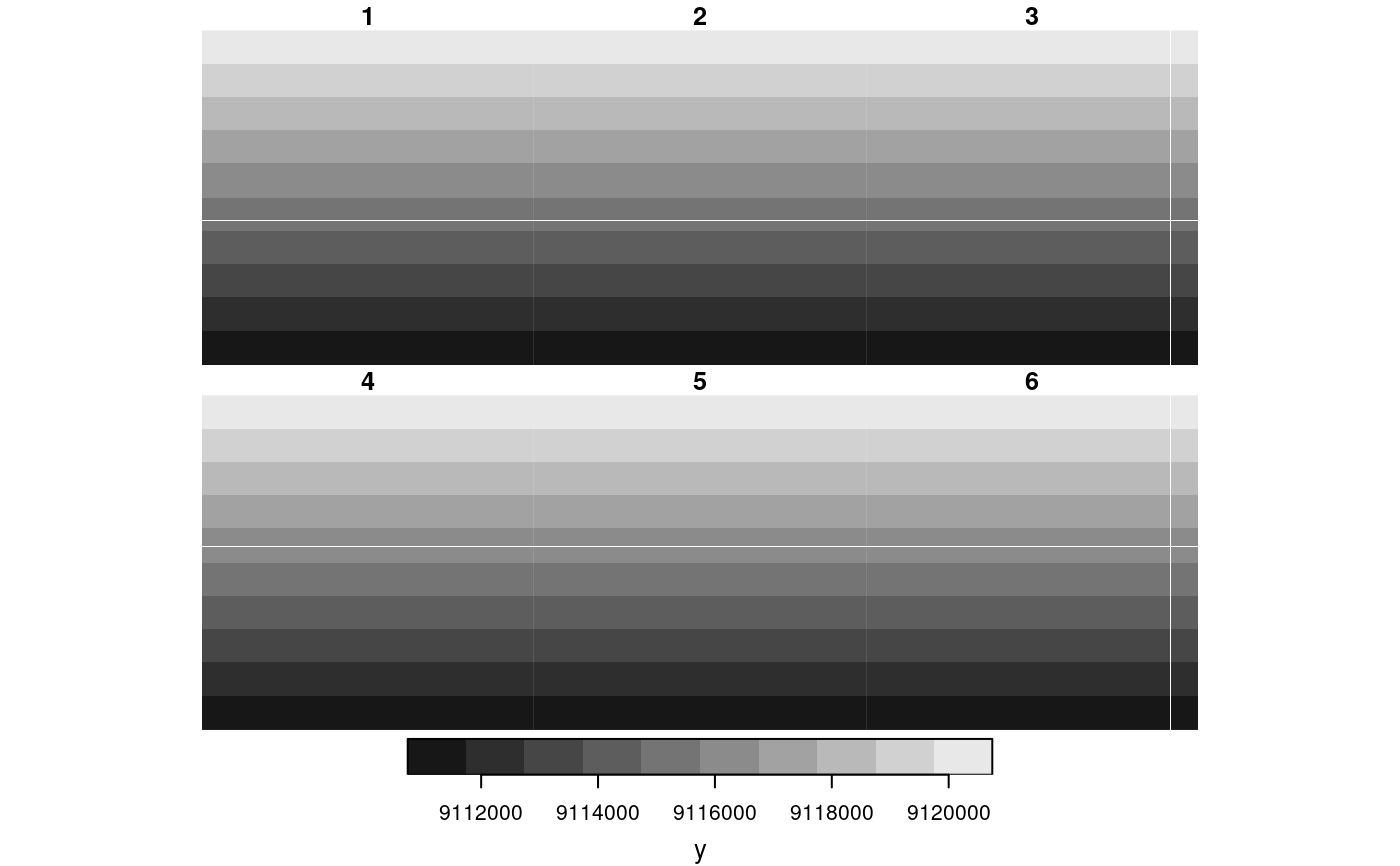
plot(x)

(x= st_dim_to_attr(x1, 3))
#> stars object with 3 dimensions and 1 attribute
#> attribute(s):
#>       Min. 1st Qu. Median Mean 3rd Qu. Max.
#> band     1       2    3.5  3.5       5    6
#> dimension(s):
#>      from  to  offset delta                     refsys point x/y
#> x       1 349  288776  28.5 SIRGAS 2000 / UTM zone 25S FALSE [x]
#> y       1 352 9120761 -28.5 SIRGAS 2000 / UTM zone 25S FALSE [y]
#> band    1   6      NA    NA                         NA    NA
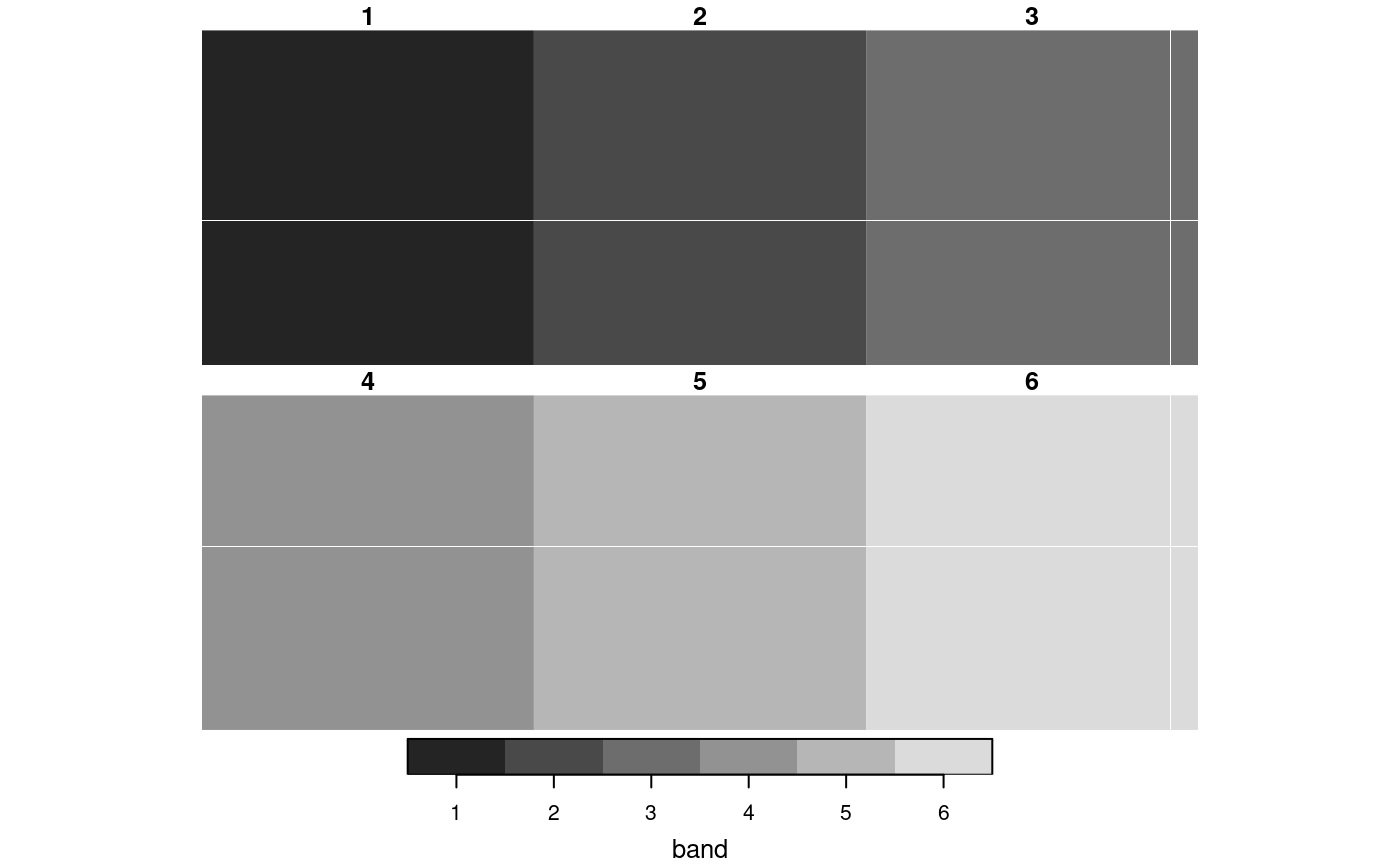
plot(x)
