subset stars objects
Usage
# S3 method for class 'stars_proxy'
x[i, ..., downsample = 0] <- value

# S3 method for class 'stars'
x[i = TRUE, ..., drop = FALSE, crop = !is_curvilinear(x)]

# S3 method for class 'stars'
x[i] <- value

st_flip(x, which = 1)
Arguments
- x
object of class
stars- i
first selector: integer, logical or character vector indicating attributes to select, or object of class
sf,sfc,bbox, orstarsused as spatial selector; see details- ...
further (logical or integer vector) selectors, matched by order, to select on individual dimensions
- downsample
downsampling rate used in case
iis astars_proxyobject- value
array of dimensions equal to those in
x, or a vector or value that will be recycled to such an array- drop
logical or character; if
TRUE, degenerate dimensions (with only one value) are dropped; ifcharactername(s) of the degenerate dimension(s) to drop- crop
logical; if
TRUEand parameteriis a spatial geometry (sforsfc) object, the extent (bounding box) of the result is cropped to match the extent ofiusing st_crop. Cropping curvilinear grids is not supported.- which
character or integer; dimension(s) to be flipped
Value
st_flip flips (reverts) the array values along the chosen dimension
without(s) changing the dimension properties
Details
If i is an object of class sf, sfc or bbox, the spatial subset covering this geometry is selected, possibly followed by cropping the extent. Array values for which the cell centre is not inside the geometry are assigned NA. If i is of class stars, and attributes of i are logical, cells in x corresponding to NA or FALSE cells in i are assigned an NA. Dimension ranges containing negative values or NA may be partially supported. Character selectors are matched against the names of a dimension if it has names, otherwise to the dimension values.
in an assignment (or replacement form, [<-), argument i needs to be either (i) a stars object with logical attribute(s) that has dimensions matching (possibly after recycling) those of x, in which case the TRUE cells will be replaced and i and/or value will be recycled to the dimensions of the arrays in x, or (ii) a length-one integer or character vector indicating which array to replace, in which case value may be stars object or a vector or array (that will be recycled).
Examples
tif = system.file("tif/L7_ETMs.tif", package = "stars")
x = read_stars(tif)
x[,,,1:3] # select bands
#> stars object with 3 dimensions and 1 attribute
#> attribute(s):
#> Min. 1st Qu. Median Mean 3rd Qu. Max.
#> L7_ETMs.tif 21 58 70 70.36041 83 255
#> dimension(s):
#> from to offset delta refsys point x/y
#> x 1 349 288776 28.5 SIRGAS 2000 / UTM zone 25S FALSE [x]
#> y 1 352 9120761 -28.5 SIRGAS 2000 / UTM zone 25S FALSE [y]
#> band 1 3 NA NA NA NA
x[,1:100,100:200,] # select x and y by range
#> stars object with 3 dimensions and 1 attribute
#> attribute(s):
#> Min. 1st Qu. Median Mean 3rd Qu. Max.
#> L7_ETMs.tif 13 54 65 67.21531 77 252
#> dimension(s):
#> from to offset delta refsys point x/y
#> x 1 100 288776 28.5 SIRGAS 2000 / UTM zone 25S FALSE [x]
#> y 100 200 9120761 -28.5 SIRGAS 2000 / UTM zone 25S FALSE [y]
#> band 1 6 NA NA NA NA
x["L7_ETMs.tif"] # select attribute
#> stars object with 3 dimensions and 1 attribute
#> attribute(s):
#> Min. 1st Qu. Median Mean 3rd Qu. Max.
#> L7_ETMs.tif 1 54 69 68.91242 86 255
#> dimension(s):
#> from to offset delta refsys point x/y
#> x 1 349 288776 28.5 SIRGAS 2000 / UTM zone 25S FALSE [x]
#> y 1 352 9120761 -28.5 SIRGAS 2000 / UTM zone 25S FALSE [y]
#> band 1 6 NA NA NA NA
xy = structure(list(x = c(293253.999046018, 296400.196497684), y = c(9113801.64775462,
9111328.49619133)), names = c("x", "y"))
pts = st_as_sf(data.frame(do.call(cbind, xy)), coords = c("x", "y"), crs = st_crs(x))
image(x, axes = TRUE)
plot(st_as_sfc(st_bbox(pts)), col = NA, add = TRUE)
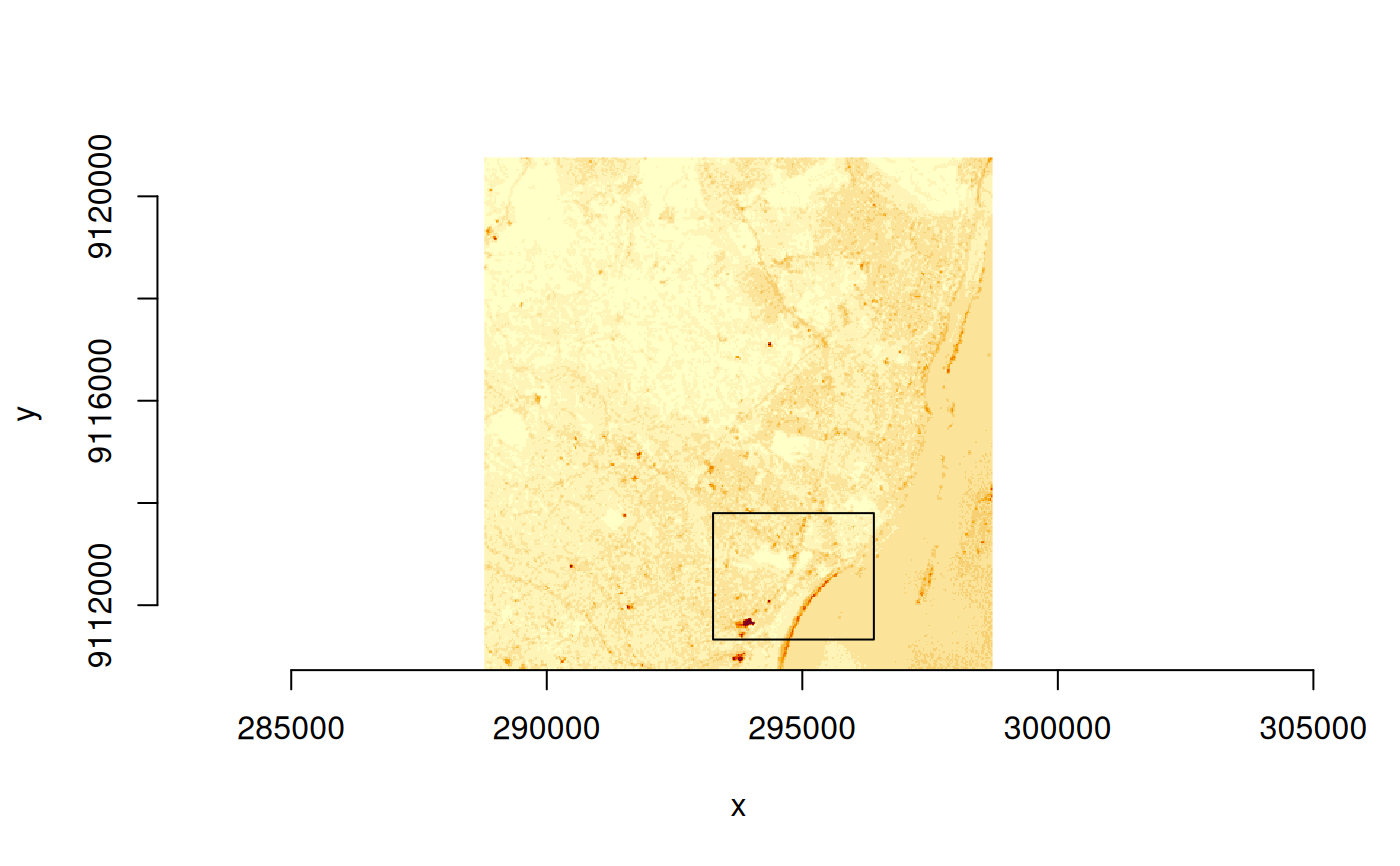 bb = st_bbox(pts)
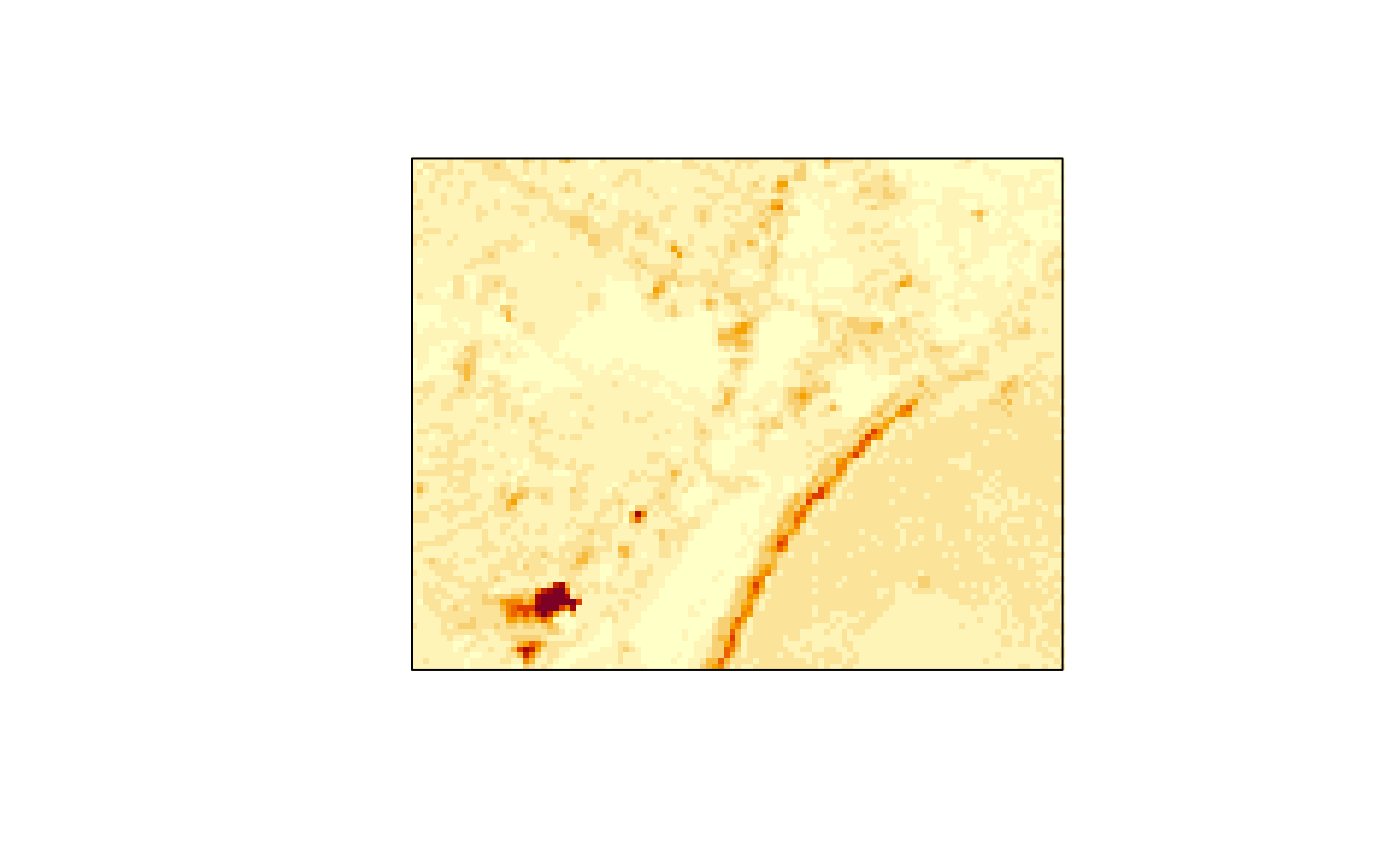
(xx = x[bb])
#> stars object with 3 dimensions and 1 attribute
#> attribute(s):
#> Min. 1st Qu. Median Mean 3rd Qu. Max.
#> L7_ETMs.tif 3 56 73 70.87303 89 255
#> dimension(s):
#> from to offset delta refsys point x/y
#> x 158 268 288776 28.5 SIRGAS 2000 / UTM zone 25S FALSE [x]
#> y 245 331 9120761 -28.5 SIRGAS 2000 / UTM zone 25S FALSE [y]
#> band 1 6 NA NA NA NA
image(xx)
plot(st_as_sfc(bb), add = TRUE, col = NA)
bb = st_bbox(pts)
(xx = x[bb])
#> stars object with 3 dimensions and 1 attribute
#> attribute(s):
#> Min. 1st Qu. Median Mean 3rd Qu. Max.
#> L7_ETMs.tif 3 56 73 70.87303 89 255
#> dimension(s):
#> from to offset delta refsys point x/y
#> x 158 268 288776 28.5 SIRGAS 2000 / UTM zone 25S FALSE [x]
#> y 245 331 9120761 -28.5 SIRGAS 2000 / UTM zone 25S FALSE [y]
#> band 1 6 NA NA NA NA
image(xx)
plot(st_as_sfc(bb), add = TRUE, col = NA)
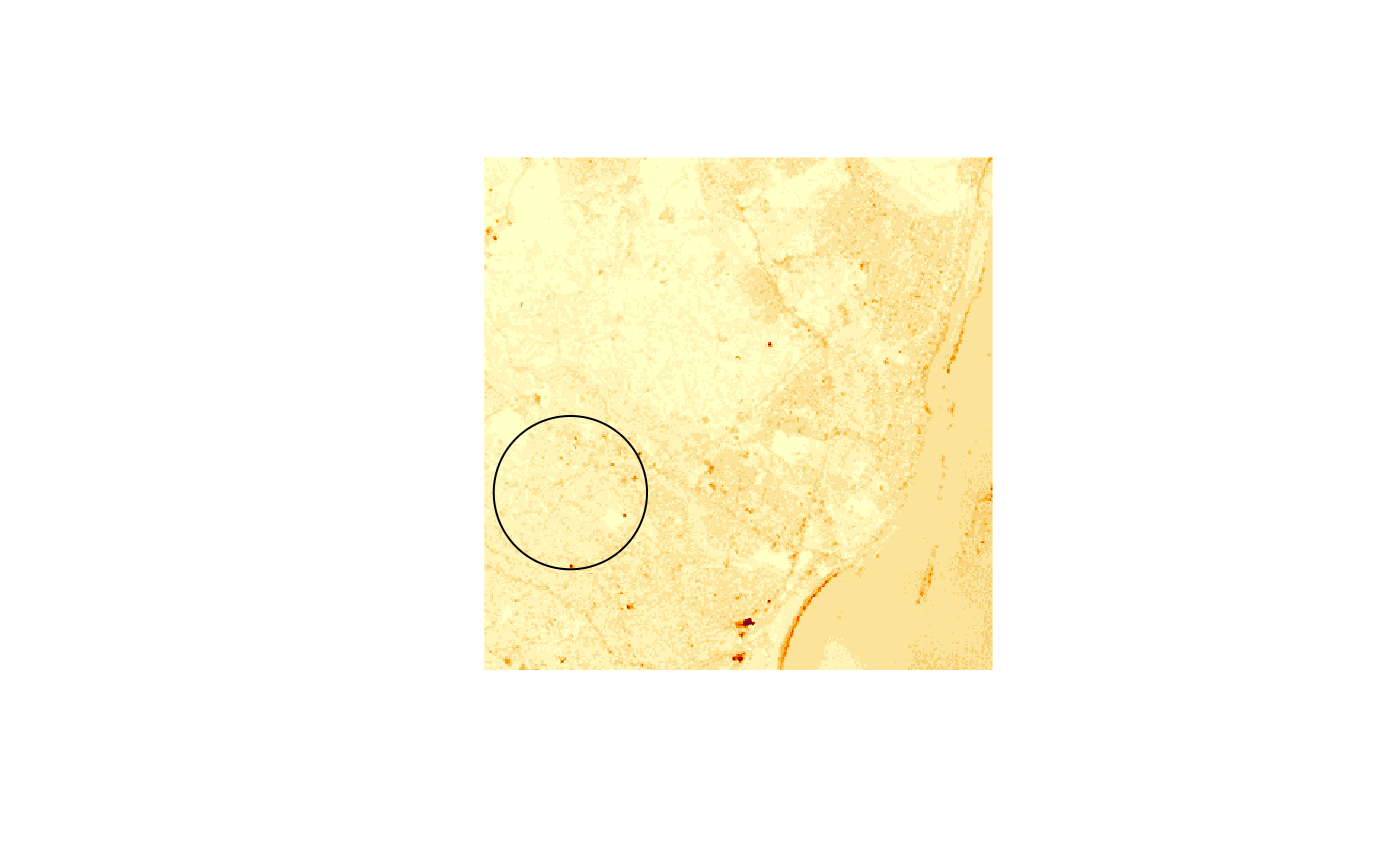
 image(x)
pt = st_point(c(x = 290462.103109179, y = 9114202.32594085))
buf = st_buffer(st_sfc(pt, crs = st_crs(x)), 1500)
plot(buf, add = TRUE)
image(x)
pt = st_point(c(x = 290462.103109179, y = 9114202.32594085))
buf = st_buffer(st_sfc(pt, crs = st_crs(x)), 1500)
plot(buf, add = TRUE)
 buf = st_sfc(st_polygon(list(st_buffer(pt, 1500)[[1]], st_buffer(pt, 1000)[[1]])),
crs = st_crs(x))
image(x[buf])
plot(buf, add = TRUE, col = NA)
buf = st_sfc(st_polygon(list(st_buffer(pt, 1500)[[1]], st_buffer(pt, 1000)[[1]])),
crs = st_crs(x))
image(x[buf])
plot(buf, add = TRUE, col = NA)
 image(x[buf, crop=FALSE])
plot(buf, add = TRUE, col = NA)
image(x[buf, crop=FALSE])
plot(buf, add = TRUE, col = NA)
 # with i of class stars:
x[x > 75] # generates lots of NA's; pattern for each band
#> stars object with 3 dimensions and 1 attribute
#> attribute(s):
#> Min. 1st Qu. Median Mean 3rd Qu. Max. NAs
#> L7_ETMs.tif 76 82 90 94.40052 101 255 443210
#> dimension(s):
#> from to offset delta refsys point x/y
#> x 1 349 288776 28.5 SIRGAS 2000 / UTM zone 25S FALSE [x]
#> y 1 352 9120761 -28.5 SIRGAS 2000 / UTM zone 25S FALSE [y]
#> band 1 6 NA NA NA NA
x[x[,,,1] > 75] # recycles a single band template for all bands
#> stars object with 3 dimensions and 1 attribute
#> attribute(s):
#> Min. 1st Qu. Median Mean 3rd Qu. Max. NAs
#> L7_ETMs.tif 1 63 79 74.98075 93 255 318960
#> dimension(s):
#> from to offset delta refsys point x/y
#> x 1 349 288776 28.5 SIRGAS 2000 / UTM zone 25S FALSE [x]
#> y 1 352 9120761 -28.5 SIRGAS 2000 / UTM zone 25S FALSE [y]
#> band 1 6 NA NA NA NA
x = read_stars(tif)
# replace, using a logical stars selector: cuts all values above 90 to 90
x[x > 90] = 90
# replace a single attribute when there are more than one:
s = split(x)
names(s) = paste0("band", 1:6)
# rescale only band 1:
s[1] = s[1] * 0.75
# rescale only attribute named "band2":
s["band2"] = s["band2"] * 0.85
# create a new attribute from a numeric vector:
s["rnorm"] = rnorm(prod(dim(s)))
s
#> stars object with 2 dimensions and 7 attributes
#> attribute(s):
#> Min. 1st Qu. Median Mean 3rd Qu. Max.
#> band1 35.250000 50.2500000 58.500000000 57.878219426 66.750000 67.500000
#> band2 27.200000 46.7500000 56.100000000 56.776205555 67.150000 76.500000
#> band3 21.000000 49.0000000 63.000000000 62.777008987 77.000000 90.000000
#> band4 9.000000 52.0000000 63.000000000 58.940544413 75.000000 90.000000
#> band5 1.000000 63.0000000 89.000000000 71.285092146 90.000000 90.000000
#> band6 1.000000 32.0000000 60.000000000 56.662127182 88.000000 90.000000
#> rnorm -5.096659 -0.6761147 -0.004160574 -0.003658478 0.669945 4.216072
#> dimension(s):
#> from to offset delta refsys point x/y
#> x 1 349 288776 28.5 SIRGAS 2000 / UTM zone 25S FALSE [x]
#> y 1 352 9120761 -28.5 SIRGAS 2000 / UTM zone 25S FALSE [y]
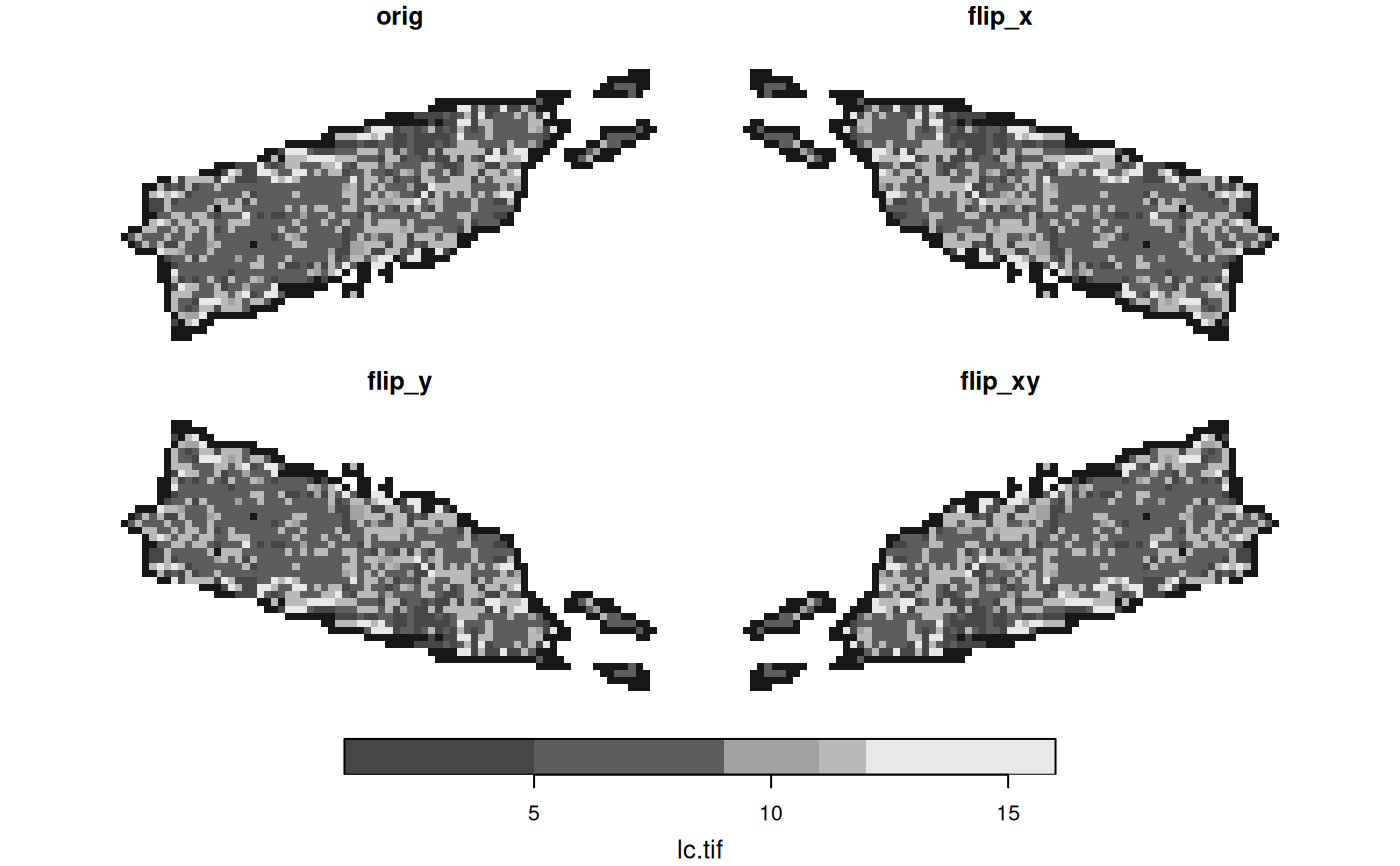
lc = read_stars(system.file("tif/lc.tif", package = "stars"))
x = c(orig = lc,
flip_x = st_flip(lc, "x"),
flip_y = st_flip(lc, "y"),
flip_xy = st_flip(lc, c("x", "y")),
along = 3)
plot(x)
# with i of class stars:
x[x > 75] # generates lots of NA's; pattern for each band
#> stars object with 3 dimensions and 1 attribute
#> attribute(s):
#> Min. 1st Qu. Median Mean 3rd Qu. Max. NAs
#> L7_ETMs.tif 76 82 90 94.40052 101 255 443210
#> dimension(s):
#> from to offset delta refsys point x/y
#> x 1 349 288776 28.5 SIRGAS 2000 / UTM zone 25S FALSE [x]
#> y 1 352 9120761 -28.5 SIRGAS 2000 / UTM zone 25S FALSE [y]
#> band 1 6 NA NA NA NA
x[x[,,,1] > 75] # recycles a single band template for all bands
#> stars object with 3 dimensions and 1 attribute
#> attribute(s):
#> Min. 1st Qu. Median Mean 3rd Qu. Max. NAs
#> L7_ETMs.tif 1 63 79 74.98075 93 255 318960
#> dimension(s):
#> from to offset delta refsys point x/y
#> x 1 349 288776 28.5 SIRGAS 2000 / UTM zone 25S FALSE [x]
#> y 1 352 9120761 -28.5 SIRGAS 2000 / UTM zone 25S FALSE [y]
#> band 1 6 NA NA NA NA
x = read_stars(tif)
# replace, using a logical stars selector: cuts all values above 90 to 90
x[x > 90] = 90
# replace a single attribute when there are more than one:
s = split(x)
names(s) = paste0("band", 1:6)
# rescale only band 1:
s[1] = s[1] * 0.75
# rescale only attribute named "band2":
s["band2"] = s["band2"] * 0.85
# create a new attribute from a numeric vector:
s["rnorm"] = rnorm(prod(dim(s)))
s
#> stars object with 2 dimensions and 7 attributes
#> attribute(s):
#> Min. 1st Qu. Median Mean 3rd Qu. Max.
#> band1 35.250000 50.2500000 58.500000000 57.878219426 66.750000 67.500000
#> band2 27.200000 46.7500000 56.100000000 56.776205555 67.150000 76.500000
#> band3 21.000000 49.0000000 63.000000000 62.777008987 77.000000 90.000000
#> band4 9.000000 52.0000000 63.000000000 58.940544413 75.000000 90.000000
#> band5 1.000000 63.0000000 89.000000000 71.285092146 90.000000 90.000000
#> band6 1.000000 32.0000000 60.000000000 56.662127182 88.000000 90.000000
#> rnorm -5.096659 -0.6761147 -0.004160574 -0.003658478 0.669945 4.216072
#> dimension(s):
#> from to offset delta refsys point x/y
#> x 1 349 288776 28.5 SIRGAS 2000 / UTM zone 25S FALSE [x]
#> y 1 352 9120761 -28.5 SIRGAS 2000 / UTM zone 25S FALSE [y]
lc = read_stars(system.file("tif/lc.tif", package = "stars"))
x = c(orig = lc,
flip_x = st_flip(lc, "x"),
flip_y = st_flip(lc, "y"),
flip_xy = st_flip(lc, c("x", "y")),
along = 3)
plot(x)